POWER GRID SIMULATION
User’s Manual
CS39x, WS’01
David Fries
Joe Barker
Don Benne
Geoff Roth
Ryan Rule
Matt Ryan
Phil Thiem
1. INTRODUCTION
The Power Grid Simulation Program was written to graphically show the effects of power distribution and reconfiguration of a power grid system. This project was sponsored by Dr. Bruce McMillin of the University of Missouri-Rolla Computer Science Department. The project is intended to provide a user-friendly "front end" for a power distribution calculation program "back end" provided by a research team headed by Dr. McMillin. The project was also intended for use as a possible demonstration of Computer Science projects. In addition, Mr. Joseph Walker of Applied Transportation Solutions, Inc., may also be evaluating the program for potential use in his own business. In order to accommodate the desire for this project to serve as a demonstration project, it was decided to attempt to implement three versions (Unix, Windows, and Internet) of the front end to provide for project portability.
The Power Grid Simulation Program (PGSP) begins by taking a configuration file containing the geographical coordinates of each power node, whether the node is a source and/or sink, the connections (lines) between nodes, and the maximum flow on that line. This configuration file is then sent from the front end graphical user interface (GUI) to a server via a socket connection, and the server calls the backend program, which takes the configuration file and uses it to calculate the power distribution for the grid, and then returns that information to the server. The server takes the information and sends it back to the GUI via the socket connection, and the GUI interprets and redisplays the new information. The GUI displays the nodes and lines at their geographic coordinates over an optional background image. The GUI checks the current flow on each line versus that line’s maximum flow, and displays the line in a particular color to indicate the power flow upon the line. (A key to the colors used and their meanings can be found in the "Using the Power Grid Simulation Program" section.) After the initial calculations and display, users are able to move the image, and "zoom" in or out on the image in order to more clearly see it. Information, such as maximum flow, direction of flow, and nodes connected, can be obtained for each line. Finally, users are able to toggle lines "on" or "off," and recalculate the power distribution to observe the effects upon the grid.
2. USING THE POWER GRID SIMULATION PROGRAM
Currently, there are three versions of the PGSP GUI for use on different platforms. These platforms are:
For the Web version, the web browser used to view the page must support javascripts and cookies.
The server must be run on a Unix architecture machine.
The following libraries must also be included, compiled, and in the system path for the PGSP to run:
(For information on where to obtain these libraries, and how to include them into the system path, see the "Maintaining and Updating the PGSP" section.)
2.2 Running the Server and Backend
To start the server, go to the PGSP main directory. From there, switch to the server subdirectory. To start the server, type
server port_no
where port_no is an available port number.
2.3 Configuration and Update File Specifications
There are two files that the program reads, the configuration file and the update file. The configuration file defines everything the program needs except how much current is flowing on the lines. The update file is what comes from running the backend and provides how much current is actually going though each line. Both files are formatted with a single character beginning the line and that character tells what data is contained in that line. The following is a list of the characters used to begin each line of the configuration file:
2.4 Using the Graphical User Interface (GUI)
To begin the Unix GUI, from a terminal window, change to the PGSP main directory. From there, go into the src subdirectory. To start the Unix GUI, enter the command:
power_client configuration_file
where configuration_file is the name of (and if necessary directory path to) the appropriate configuration file.
In addition, several optional command line parameters are also available. They are:
The -p and -a commands can be used to specify where the backend server is located, overriding the default settings. Once started, the GUI will then be brought up in its own window.
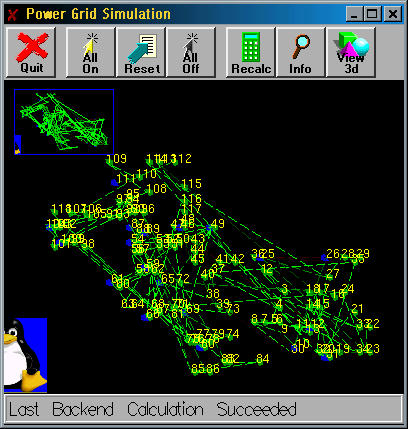
The GUI has three main parts to it: the buttons toolbar, the graphic display, and the message display.
BUTTONS TOOLBAR:
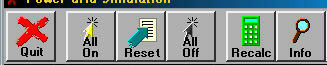
The buttons toolbar, located at the top of the GUI, has six buttons: Quit, All On, Reset, All Off, Recalc, and Info. Following is a description of what each button does:
GRAPHIC DISPLAY:
The graphic display, located in the middle of the GUI, shows the user the layout of the power grid. The nodes of the power grid consist of power sources and/or power sinks (both may be present at a single node), and are represented by half octagons. The power lines are represented by animated dashed lines. The dashes move, marquee-fashion, in the direction of the power flow on the line. The lines and nodes are rendered in different colors depending on their different states. The colors and their corresponding meanings are given in the following tables:
Nodes
|
Lines
| Color | Meaning |
| bright green | 100% capacity |
| dark green | 90-99% capacity |
| dark red | <89% capacity |
| bright red | 0% capacity |
| blue | disabled |
The graphic display allows the user to pan the image and zoom it in or out for examination purposes. To pan the image in any direction, simply hold down the left mouse button, and move the mouse in the desired direction. To zoom in on the image, hold down the right mouse button, and move the mouse towards the top of the screen. To zoom out, hold down the right mouse button, and move the mouse towards the bottom of the screen. A small navigation map in the upper left corner of the graphic display shows the entire power grid, and a white box will appear on it to indicate the part of the grid that is currently being shown. In addition, the user can click on a section of the navigation map to center the image on that point.
To toggle a power line on or off, click on the line with the left mouse button. The line will change color accordingly. To see the results of the change, press the Recalc button on the buttons toolbar. To view information about the line, click the Info button on the buttons toolbar, and then select that line with the left mouse button.
MESSAGE DISPLAY:
The message display is the gray textbox located at the bottom of the GUI.

The following messages can be displayed:
When the GUI is in Info mode, the message display will show information on the selected line. This message takes the form: [Functional/Disabled] power line from node x to node x: Max = xxxx, Current = xxxx. [x’s represent actual numbers provided by the GUI]
To start the Windows version of the GUI, go to the command prompt. Change to the directory in which the executable is kept, and enter the following command:
PowerGrid.exe [configuration_file]
The command line options available in the Unix version are also available for the Windows version. If no configuration file is specified in the command line, the Windows GUI will automatically bring up an Open File window to allow the user to select a configuration file.
Once the Windows GUI has been started, usage is the same as in the Unix version.
The Internet version of the PGSP GUI enables users to run the PGSP from any place that has access to the World Wide Web. As of the writing of this manual, the Web GUI can be accessed at http://wwwcgi.umr.edu/cgi-bin/cgiwrap/dfries/form.bin [2].
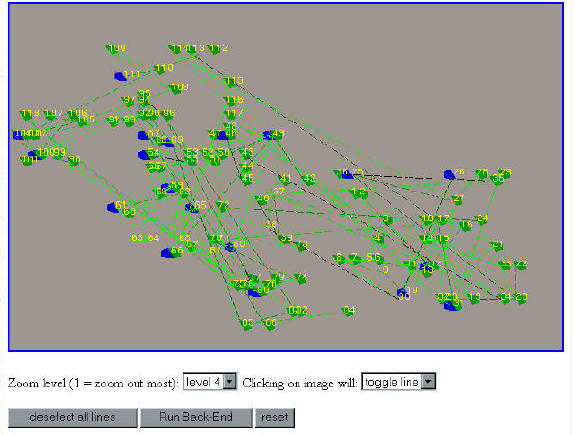
There are several significant differences between the Web GUI and the Unix and Windows versions. To begin with, the Web page loads a non-animated display of the power grid, located at the top of the screen. This display has no quick navigation map, nor can the user pan or zoom in the same manner as the Unix/Windows GUIs can.
Unlike the Unix and Windows versions of the GUI, the power distribution for the grid is not automatically calculated upon first loading the page. To see the initial distribution, click on the Run Back-End button at the bottom of the screen. The page will then reload with the updated power distribution.
The buttons and settings available for the Web GUI are located at the bottom of the page. They include the deselect all lines, Run Back-End, and reset buttons, the zoom level selection box, and the mouseclick action selection box.
The buttons on the Web GUI are similar to their counterparts in the Unix and Windows GUIs:
Due to the nature of the design of the Web GUI, it was not possible or practical to implement real-time pan and zoom capabilities for the Web. Therefore, zoom level and mouseclick action selection boxes have been incorporated into the design. The zoom level selection box allows the user to select one of nine different zoom levels. The mouseclick action selection box ("Clicking on image will:") allows the user to choose whether a mouseclick will toggle a line (the default setting), or will recenter the display on the coordinates of the mouseclick.
The Web GUI has no Info mode for obtaining information about a selected line.
To use the Web GUI to toggle lines and calculate the power redistribution, make sure that the mouseclick action selection box is set to "toggle line." Toggle the desired line(s), and then click on the Run Back-End button to recalculate the distribution. The page will automatically reload with the new display. All other actions that require a change in the display will also cause the page to automatically reload the display image.
3. TROUBLESHOOTING AND HELP
3.1 Error Messages
The following are error messages generated by the GUI:
3.1.2 SERVER / BACKEND MESSAGES
All server and backend error messages are displayed in the terminal window from which the server is being run. The majority of server errors involve opening and handling sockets. Other errors include not having a port number specified on the command line, not finding the backend program in the server’s path, and problems with forking new processes. Additionally, the backend program may throw its own errors.
3.2 Problems and Solutions
Most problems fall into two categories: configuration file problems, and library / environment problems.
3.2.1 CONFIGURATION FILE PROBLEMS
The PGSP will not work if a proper configuration file is not given. For the Unix and Windows versions, it is necessary to specify the configuration file at the command line upon startup (or additionally in the Open File window for Windows users). If you are specifying the configuration file, but are still encountering errors, first ensure that you are specifying the correct path to the configuration file. If the path is correct, but the error still occurs, then the configuration file may be corrupted and unusable. This will require a new copy of the configuration file.
3.2.2 LIBRARY / ENVIRONMENT PROBLEMS:
These errors are caused by the PGSP not being able to find the correct files / libraries needed for operation. To correct these errors, make sure that the libraries specified in the "System Requirements" section exist on your system. If the libraries are on the system, but the PGSP cannot find them, it will be necessary to look at the source code to see where the PGSP expects to find the files / libraries.
4. MAINTAINING AND UPDATING THE POWER GRID SIMULATION PROGRAM
4.1 Necessary Libraries to Include
The following software libraries must be present and compiled on the local system for the PGSP to work. In addition, the locations of these libraries must also be found in the system path. If the libraries exist on the local system, but are not present in the system path, the opengl_wrap script file, found in the src/cgi-bin subdirectory, can be modified so that when run, the libraries will be placed into the system path for the current session.
homepage http://www.mesa3d.org/
download http://sourceforge.net/projects/mesa3d
http://reality.sgi.com/opengl/glut3/glut3.html
homepage http://www.design.ru/png/
http://www.info-zip.org/pub/infozip/zlib/
also available at http://ftp.debian.org/debian/pool/main/z/zlib/
4.2 Compiling Source Code
4.2.1 UNIX / WEB / SERVER COMPILING
In order to compile the Unix, Web, and server source code, it is necessary to have the GNU C++ compiler. In order to simplify compiling, Makefiles have been used in each directory needing to be compiled. To compile the code, go to the appropriate subdirectory, and type gmake at the command line. Any changes involving moving files to new directories or adding new files to be included and compiled need to be reflected in the appropriate Makefile.
The Windows version of the GUI was originally compiled using Microsoft Visual Basic 6. Several changes were made to the Unix version to allow it to compile under Windows. They are as follows:
Additional changes may be needed for further updates to the program. The server-backend program is not currently able to be compiled and run on a Windows platform.
4.3 Updating the Display
4.3.1 CHANGING INTERNET DISPLAY SIZE
The size of the image generated by the Web Version of the GUI can be changed from 640 x 480 to any size supported by the web browser by changing one line.
Open the file form.cc in the src/cgi-bin subdirectory of the PGSP main directory. On line 10, simply change "WIDTH=640 HEIGHT=480" to the desired settings, and recompile the source code.
During the creation of the PGSP, it was decided that an attempt would be made to have an option to render the display in a "3-D" form for the Unix and Windows versions of the GUI. An additional button was created to switch between 3-D and regular mode, and a command line option was also added to do the same thing:
The 3-D textures and designs were coded and worked into the PGSP. However, when a user switches to 3-D mode, the different textures are not rendered properly, and all of the lines and nodes and background textures appear yellow. Due to time restrictions on the completion of the project, the code has been commented out, and left for any future programmers to try and fix if desired.
The affected files are located in the src subdirectory, and its own subdirectories.
4. 4 Updating the Backend Program
The source code for the server program is located in the server subdirectory. The backend programs are located in the backend subdirectory. In order to run properly, the backend executable must be included in the $PATH for the server.
Currently, the default address and port settings for the PGSP GUI are set to find the server on rocket.cc.umr.edu, port 3210. This setting is made in the file file, and will need to be changed to the sponsor’s system once the project has been transferred over.
In order to change the backend, several changes would need to be made to the PGSP. To begin with, in server.cpp, line 57,
n = system( "type GOLD" );
"GOLD" will have to be replaced by the name of the new executable.
Starting around line 107, the argument string that is created for the system call to the backend will have to be changed. Currently, a character buffer is used to create the command line necessary to run the backend. The GOLD program requires the specification of an input file, and additionally, the server also uses the optional output filename specification [More on how the server handles input and output to GOLD will be discussed further on]. Appropriate changes will have to be made to handle differences in the command line arguments necessary to run the new backend.
As mentioned in the previous paragraph, the GOLD backend program takes in an input file, gets the information from it, and returns an output file. To create the necessary input file, the server receives a stream of characters from the OpenGL client in the appropriate format for the GOLD input file. The server takes this stream and writes it to a file, and then passes this file to the GOLD executable. Should the backend use a different method of input and output, appropriate changes will need to be made to handle the input to and output from the backend.
If the new backend program uses a different format for its configuration file, such formatting changes will need to be made in the OpenGL client program in order to format the character stream to the server so that the correct input can be given to the backend.
4.5 Overview of the Basic Design
The following sections contain a general overview of the manner in which the key PGSP components operate. This overview is intended to help a programmer get an idea of what each part of the program is doing.
The PGSP server program runs on Unix architecture. The server operates as a daemon program, waiting for connection requests from the GUI OpenGL clients. When a request is received, the daemon opens a new socket to the requesting client, forks off a new process to handle the request, and goes back to listening for connection requests. The new process receives a character stream from the OpenGL client, writes it into a file, and then passes that file to the GOLD backend program. The backend takes the input file and calculates the power distribution for the power grid system, and puts the information into an output file. The child process then takes the output file generated by GOLD, converts it back into a character stream, and sends that stream back to the OpenGL client. Once this operation is complete, the child process deletes the input and output files it created, and exits.
Once changes have been made to the power grid in the GUI, the OpenGL client sends a connection request to the server daemon. Once that request has been accepted, and the socket connection made, the client sends a character stream, formatted to become the input file for the backend, over the socket to the child process spawned by the server. After the backend has finished doing the recalculations, the client then receives the character stream of the output file back from the server child process.
The GUI takes the information from the OpenGL client, and uses it to draw a picture of the power grid system. In addition, the GUI also handles the commands given by the user, passing on the system changes and recalculation commands to the client.
For the Web GUI, one program handles the creation of the webform page and the user input to that page, while a separate program takes that input, determines the appropriate state information for the power grid system, stores that information in a cookie, and makes the client call to the server daemon. This second program receives the recalculated system information back from the server, stores it in the cookie, and creates an image file which the webform-generating program then inserts into the page.
[1] In addition, the Unix version may also work on OS/10, which is supposed to be POSIX compliant.
[2] This address will change, however, upon transfer of the PGSP files to the recipients.