<Back
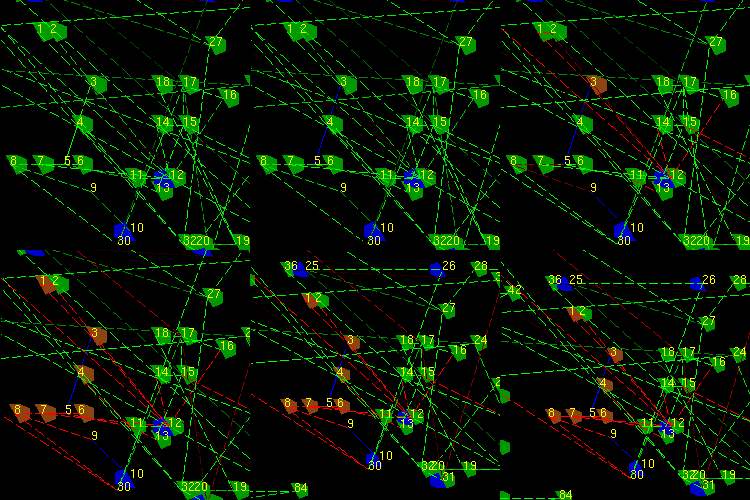
This is a sample running of the program with user interaction (mouse
pointer not shown).

Here is a list of some of the features as of April 13th.
- A green half of an octagon shows that the node is consuming power.
- A blue half shows the node is producing power, nodes can both produce
and consume power.
- A red half shows a node that doesn't have enough power to satisfy what
it should be consuming
- The color key for the lines that connect nodes are as follows.
- Brightest Green, 100% capacity
- Darkest Green, 90% capacity
- Darkest Red, 89% capacity
- Brightest Red, 0% capacity
- Blue, line is disabled
- A line can be selected turning it blue and disabling the line from
carrying any current.
- The running animation shows the direction of the current on each
line.
What follows is a list of frame numbers and what was happening
at that frame
- initial state, all lines enabled
- animation
- animation
- animation
- Lines between node 5 and 3 are selected
- animation
- backend was run updating power flow, note node 3 no longer has
power
- animation
- animation
- Line between 9 and 10 was selected
- animation
- backend run and display updated
- animation
- animation
- zooming out (by mouse)
- zooming out
- zooming out
- zooming out
- zooming out
- zooming out
- zooming out
- panning
- panning
- panning
- panning
- loop back to frame 1

